U-M Medical School Profiles & Demographics
Achieving Balance
Each year, we work with deliberate intention to create a balanced class, with every cohort making unique contributions to our collective mission and leadership legacy.
Our Students
The University of Michigan Medical School is part of a vast, collaborative community that supports learners at all levels with experts who love to share and help grow the next generation of leaders. That explains why some of the most common words to describe the Michigan experience are warm, friendly and collegial. For us that goes both ways.
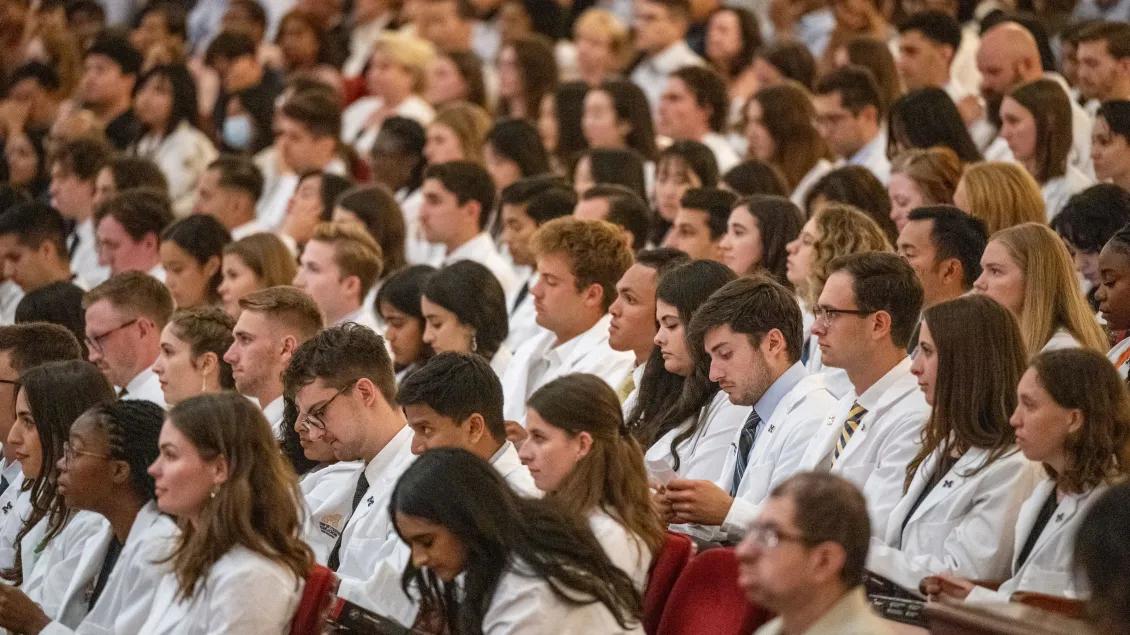
Welcoming new students into our medical school community each summer is a tradition we cherish. Achieving a balanced class as a whole arises out of deliberate focus and intention, with every cohort developing its own characteristics and experiences while making unique contributions to our collective mission and leadership legacy.
Below is a snapshot of key demographics on our entire medical student body, along with the most recent incoming class profile data.
Student Body Profile
Composition
Students identifying as:
10.2% Black / African American
11.4% Latinx
10.4% Arab American / Middle Eastern
1.4% American Indian or Alaska Native
.6% Native Hawaiian or Pacific Islander
Geography
Educational Experience
* URiM: Includes all AAMC Underrepresented in Medicine Categories + Arab American / Middle Eastern. The UMMS definition of URiM during holistic review extends beyond race and ethnicity to include LGBTQ+ applicants and applicants with disabilities.
**First Generation is generated from UMMS secondary application question: “Is your generation the first in your family to earn a bachelor's degree?”
Data available as of May 2026
ADMITTED CLASS PROFILE PDFs
UMich Med Mosaic
Welcome to UMich Med Mosaic, a podcast hosted by medical students, for medical students – and those who aspire to be! Join us as we share their diverse and unique stories as they pursue careers in medicine.
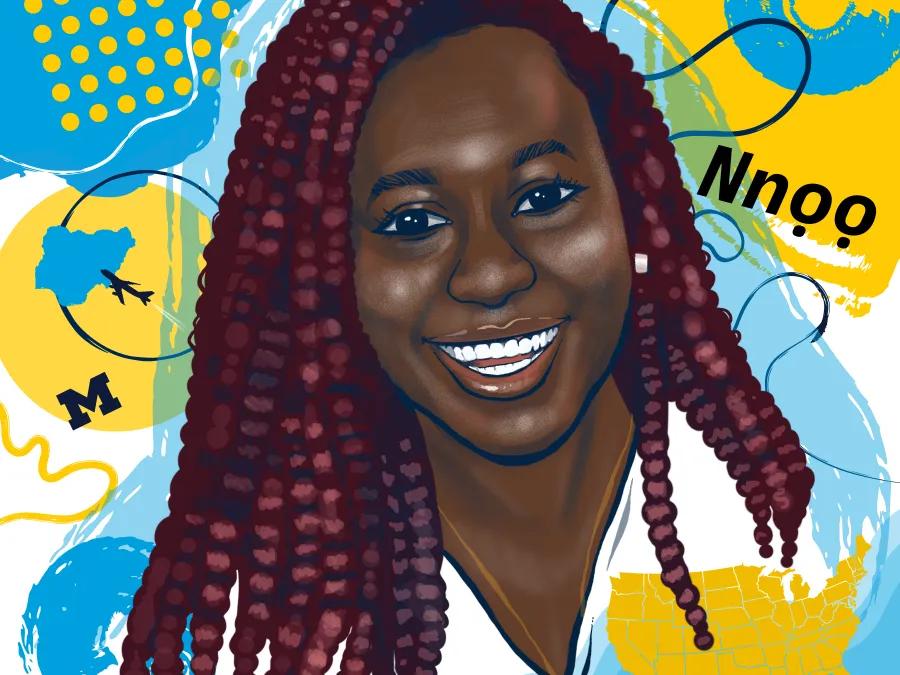
Drawn to Michigan
An inside look at the unique experiences and aspirations of students and trainees at the University of Michigan Medical School.